


Claude, you're going to blow us all away
Generative AI, or at least the right generative AI, stands to even the playing field for researchers seeking to broaden their analytical tools

I may or may not have spent three hours trying to figure out how to visualize some data I pulled together from NYT earnings reports in R. I run up against a few problems that have nothing to do with coding: I have trouble visualizing data/reading charts/thinking of good ways to present data - and I also get super twisted up in my head when there are different ways of recording quantities (e.g. revenue reported in thousands, but circulation reported as the raw count of #s, in 1s).
I tried and tried to run some graphs where I could show these various plots against each other - but I ran up against scaling issues (see above).
Claude just blew my mind.
Not only did I get Claude to do some rad visualizations, but I was also able to get Claude to do some webscraping for me. There is a lot of debugging and back and forth and auditing the results, but I’m pretty impressed. This sort of work is great to do when you feel like the world is out of your hands ….
Here’s what I tried:
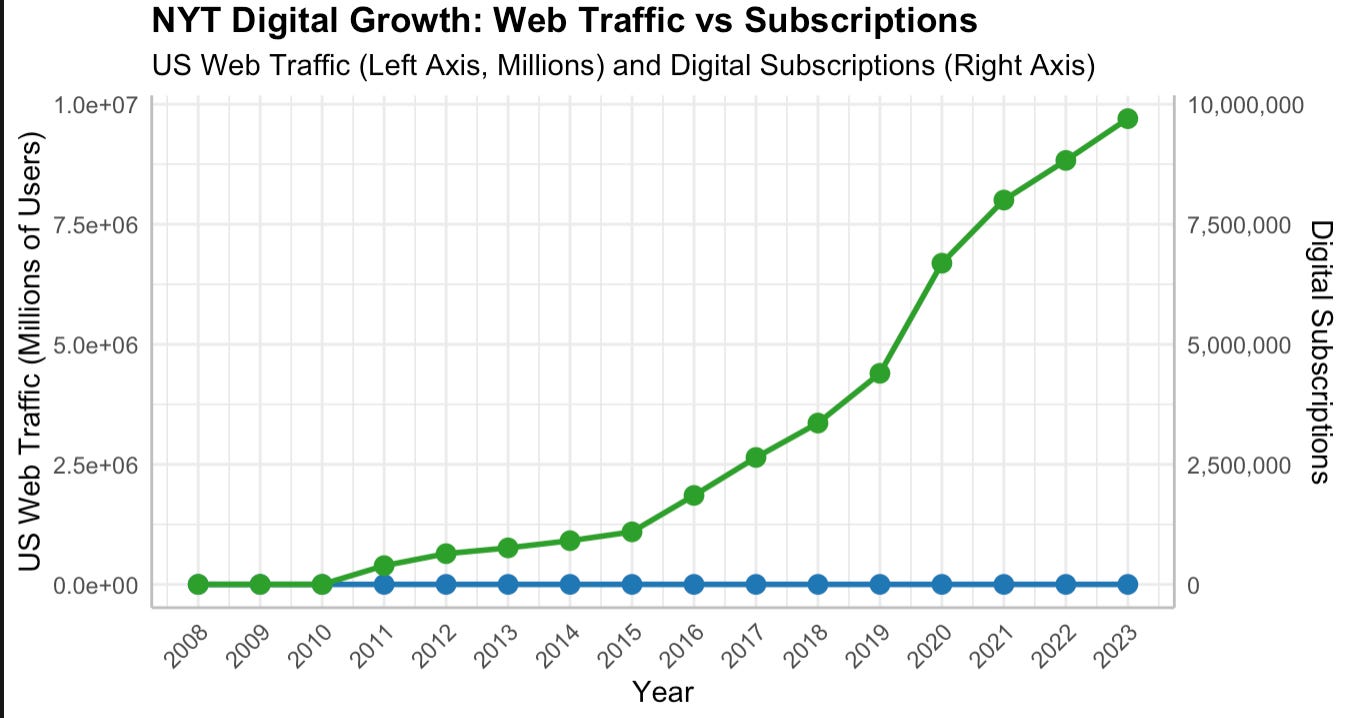
Here are some of the visualizations it was able to help me code:


Now, you do have to absolutely know your data. I am 100 percent a fan of data I can see (basically, give me under 10,000 observations and I feel like I can “know” the data) - and here, you can see that Claude messed up on units:

Wouldn’t that be nice for the NYT, no?
So this is a better picture, but I still thought the scientific notation was ugly
So I asked Claude to fix this, but we timed out, so I want to finish this post.
Scraping:
So I don’t know python, but I did manage to install Visual Studio code and get Claude to help me run a script to TRY to get all of the NYT Press Stories off the NYT press page.
I tried first in R, to be sure, but it didn’t matter: The problem is that infinite scroll is a bear, and even when I manually infinite-scrolled, the static nature of the website address (https://www.nytco.com/press-stories/) makes this a challenge. I was able to get the first 25 stories scraped, but couldn’t do anything historic.
I also tried scraping a “search” on Nieman Lab for any articles that were tagged NYT. The R code did not work.
But - structured data is our friend!
I can’t yet bring on my RAs as it is intercession here. But I do not want to copy and paste 15 years of board of directors into an excel sheet. So what I did was save every list of board of directors from all of the annual reports as individual PDFs. I uploaded them to Claude and asked Claude to extract the data. Claude was lazy, and did just 2008 and 2023 at first, and then in five year increments, but I got Claude to do each year by year. It guessed on the industry, mostly right (is Verizon tech or telecom?) and I did a visual audit. I then saved it as a text file and imported the list into excel.

And it goes on. I also find this font soothing, btw.
My next step is audit the industries, and then see if I can spot any meaningful trends here in terms of membership per type of industry, etc. and see if that has anything at all to do with strategy.
My most interesting finding thus far is that the NYT was in 2008 and 2009 almost 20% hedge fund owned.
I guess it escaped that one…. but it was not certain the newspaper would survive. In 2013, it looked like it might be sold (or there were rumors). Anyway, I have to figure out how to write this up from the perspective of the business side rather than the news side, even though the NYT would insist that its core business is “the best journalism.”
I keep plugging away as these fires burn, hoping for the best. The air is bad here, friends, but we are so lucky to be in SD.