

American Communities and American Dissatisfaction: The American Fragmentation Survey (Part I)
American Communities and American Dissatisfaction: The American Fragmentation Survey (Part I)
Or, how some early efforts at how playing with stats reveals some solid research openings

There is a data set I’ve been a fan of for a while - The American Communities Project - it’s less a dataset I guess than a more coherent way of thinking about American communities as material entities inscribed in particular types of communities - not red or blue or rural or suburban, but actual textured places with a set of shared demographic and cultural factors — 15 different communities that range from Aging Farmland to Graying America to Evangelical Hubs to the African American South and beyond. So when I saw this finding from its American Fragmentation Study, I stopped to celebrate something odd: that across our differences, there is something zany and weird about the fact that Americans, regardless of where they are from, believe that GRIT is fundamental to getting ahead in American life. Legitimately, American neoliberal, up-from-the-bootstraps style “Grit” - the American Dream, baby, is how success happens in America.
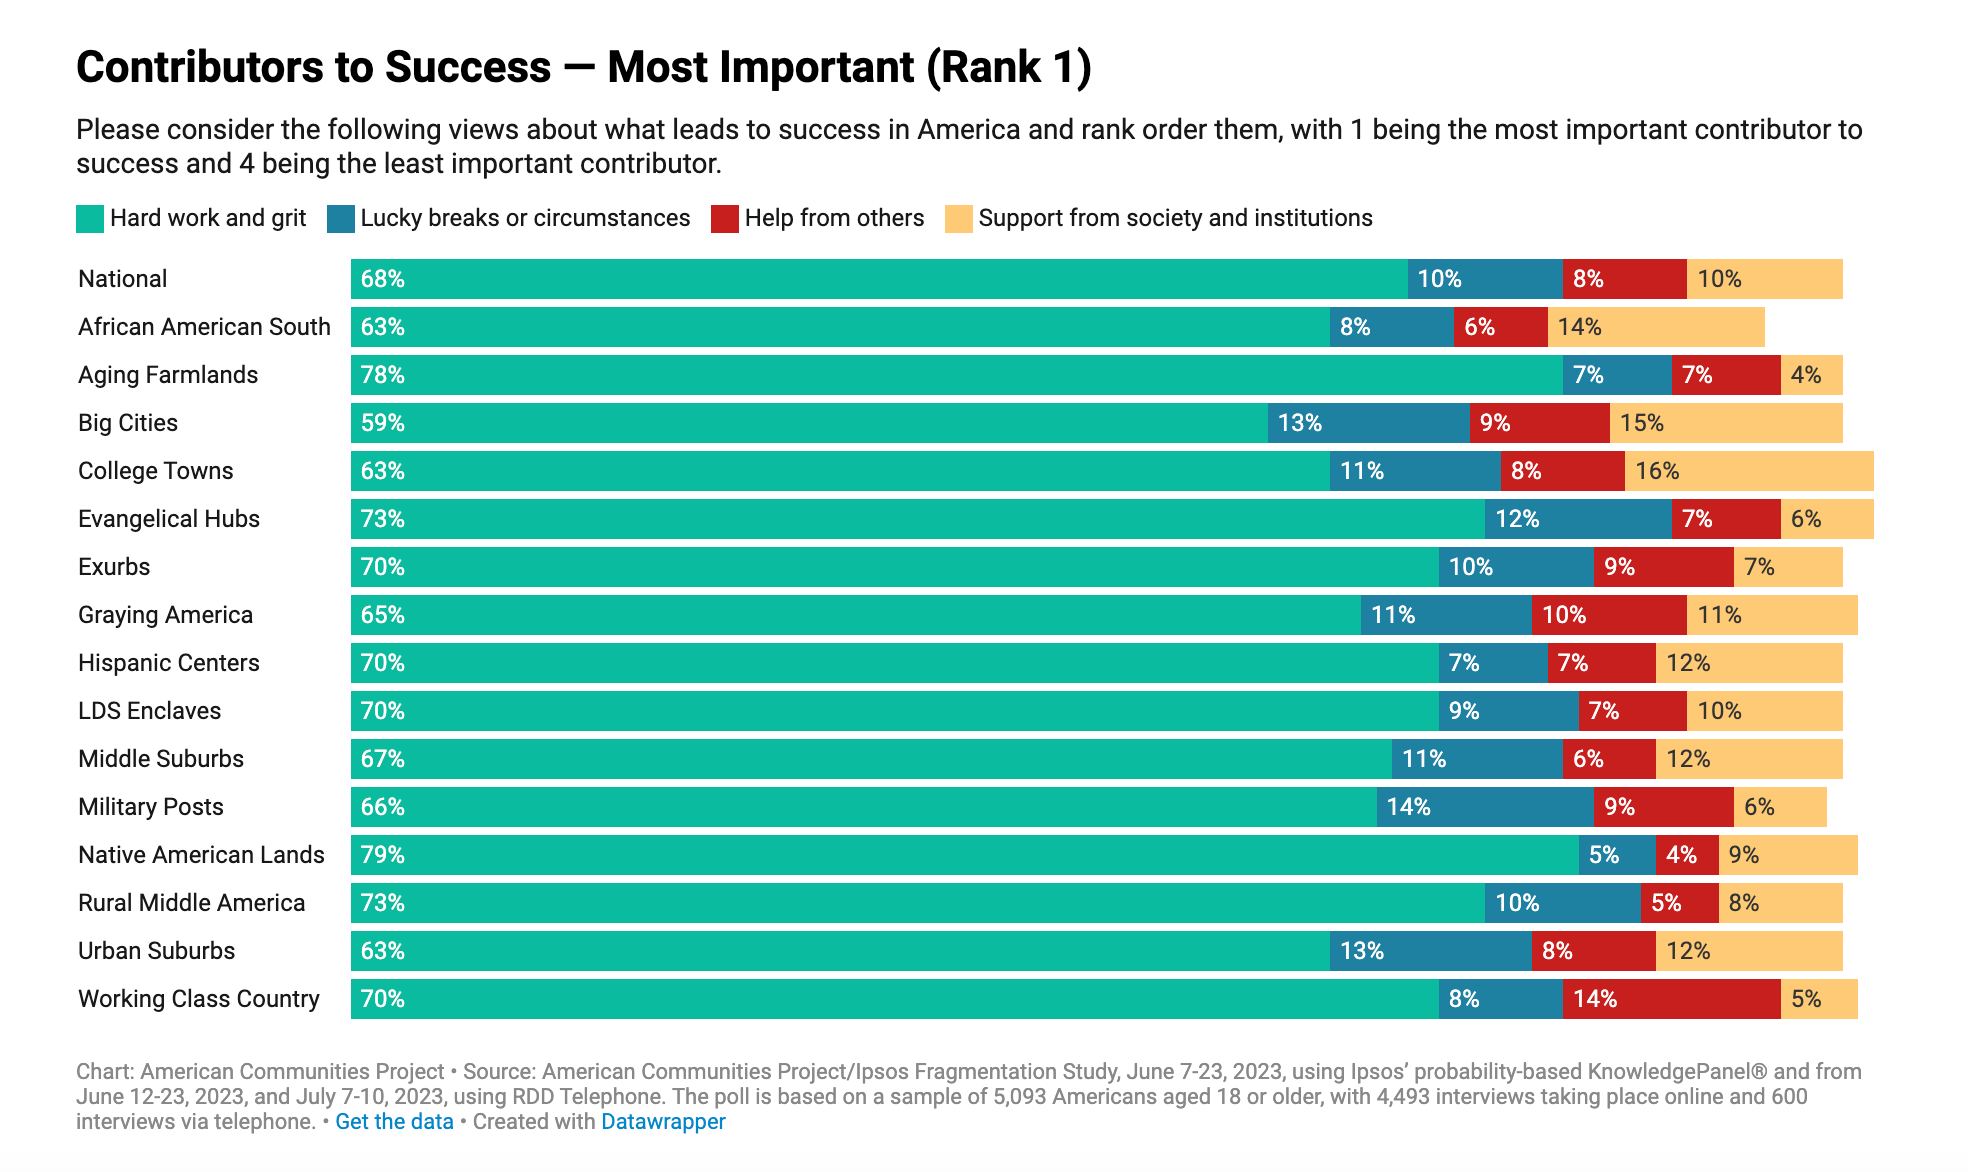
You could make the argument that politics fundamentally break down across different understandings of what the American Dream looks like and how to get there: but that people really do share in the US a belief that given the right chances and so forth, individual effort can propel someone into a successful life. This speaks to the power, I think, of why people believe that they should, can, and are entitled to trying to “make it,” broadly defined. Almost 60 percent of all Americans buy into this - and the second choice, “lucky breaks” speaks still to this idea of individuals determining their own fortunes, perhaps with unfair advantages. What an odd way of understanding social life: that we are on our own to make it? Does this not provide at one full stop a sweeping sense of why we have such a limited social safety net?
So here’s the premise I’ve been thinking about: are we more similar than we are different in terms of our general core aspirations and sense of possibility? By this I mean moving beyond politics to thinking about how we feel about living in this moment, right now, and if we are more similar than different, even if our views tend negative, maybe there is the possibility for recovering solidarity and a shared commitment to this democratic project.
The fragmentation study asks a number of questions:
the extent to which Americans have common values
that Conservative beliefs are disrespected
that America is in decline
that experts should be trusted
that the economy is rigged for the rich
it’s hard to get ahead in America
that racism is built into the American systemm
and the bingo one for me:
that the media is in it for the money
Oh my, these are spicy. What happens if we extrapolate the different findings from each community to actual, real counties? And then what happens when we start to look at the relationships between these opinion data results across various media variables? I should say at the outset that while I did clean most of the data myself, it was not efficient, at all, and then my R tutor, Zayne, gave me some shortcuts to do this way better!
So if I had to state an RQ: Does being in one community type, given a set of various opinion data responses to the questions, predict anything about how people feel about media and whether it’s available in their communities: specifically, about whether the media is in it for the money? Or whether there are fewer total newspapers in your community? Or whether there is lower circulation of news?
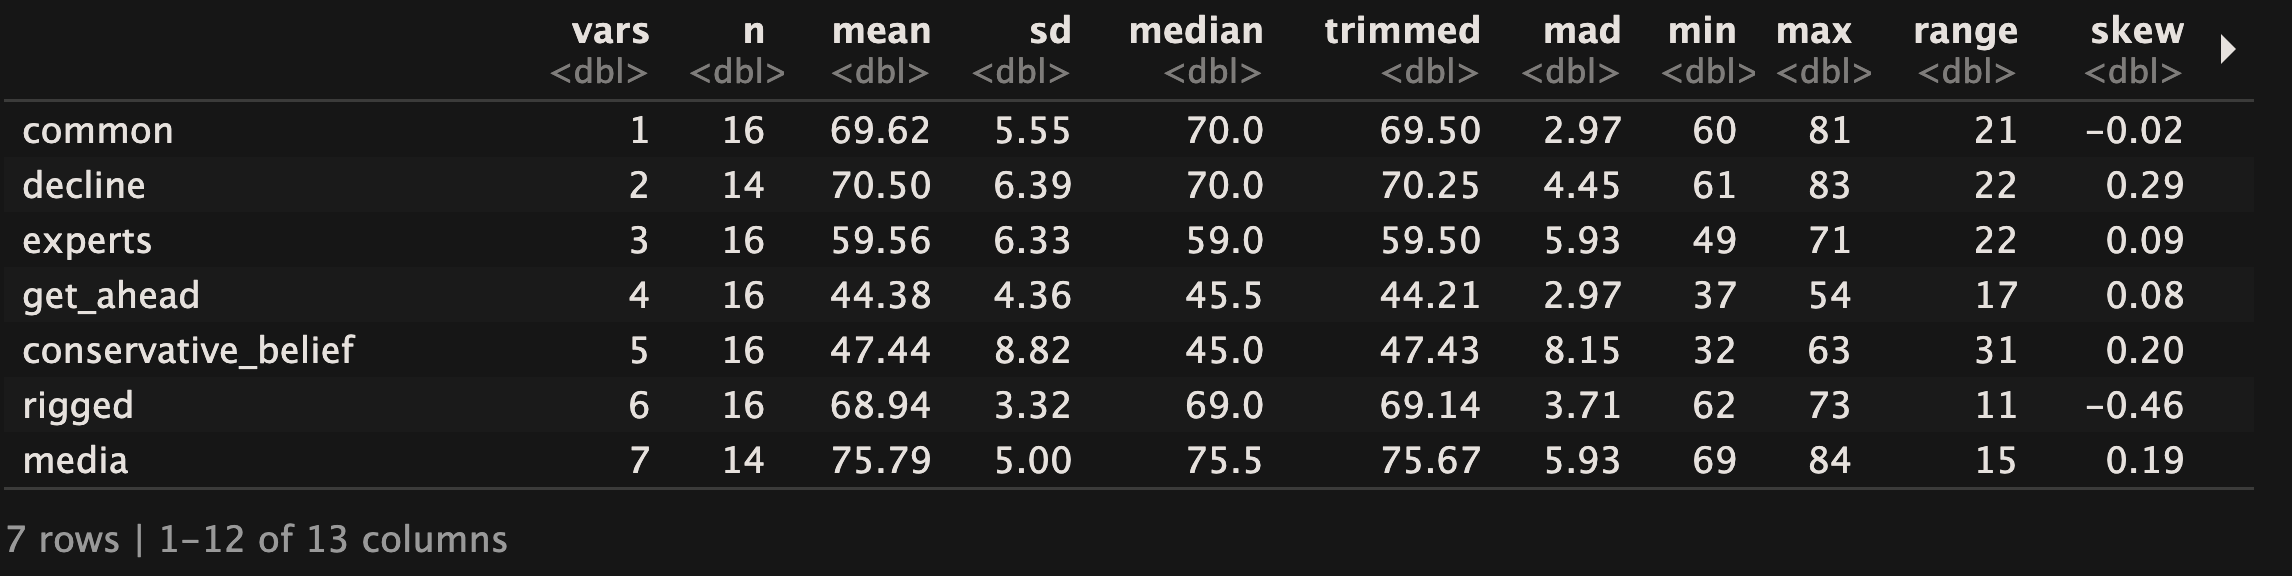
Here’s what I did to have some fun. First, I wanted to just explore the nature of each question for all of the 15 different communities. This would at least give me some sense and comfort that even with this small set of 15 observations of 7 opinions that I chose to focus on had enough properties of normality that I could feel at least half confident about expanding beyond just the 15 community types to thinking more broadly about America in its entirety. So, based on what I have learned, I did a couple of exciting QQ plots. (Really). And for each opinion question, they all looked ok. You can get a sense of this below

But, I wanted to look at AMERICA so I could maybe draw some additional inferences about what might tip the scales in terms of meaningful (or not meaningful) differences in the way people feel about the media and other additional variables related to news supply (more on that later).
Eventually, I ran a few different types of regressions for practice: basic OLS, a zero-inflated poisson model (actually, there is not a ton of zero inflation, really) to account for restricted NA data, and then I am playing with what I learned in maximum likelihood estimation and the way to think through some of these questions via probability - so I am still working through a probit model where we are trying to estimate the various characteristics that would best predict the probability of having five or more total newspapers in a county. For now, since it’s 3:46 AM and I’ve finally tired myself out, I’ll run through how I dealt with the problems in the data and compiled the data set I ultimately wanted to work with. I’ll do a part II in a different post with some results.
So how are we going to deal with the fact that we have only 15 observations and we have 3143 counties in the US? Well, my new favorite thing to do is to simulate data. Note that in a few of the opinion questions, Aging Farmlands and Native American Lands were missing, creating some issues with observations. There was also an overall national value (which I guess in retrospect I could have tested the various opinions per community type in a t-test, but later, I guess). But that’s not going to really help us think through the types of counties, their sort of “character,” and their media ecologies, roughly understood.
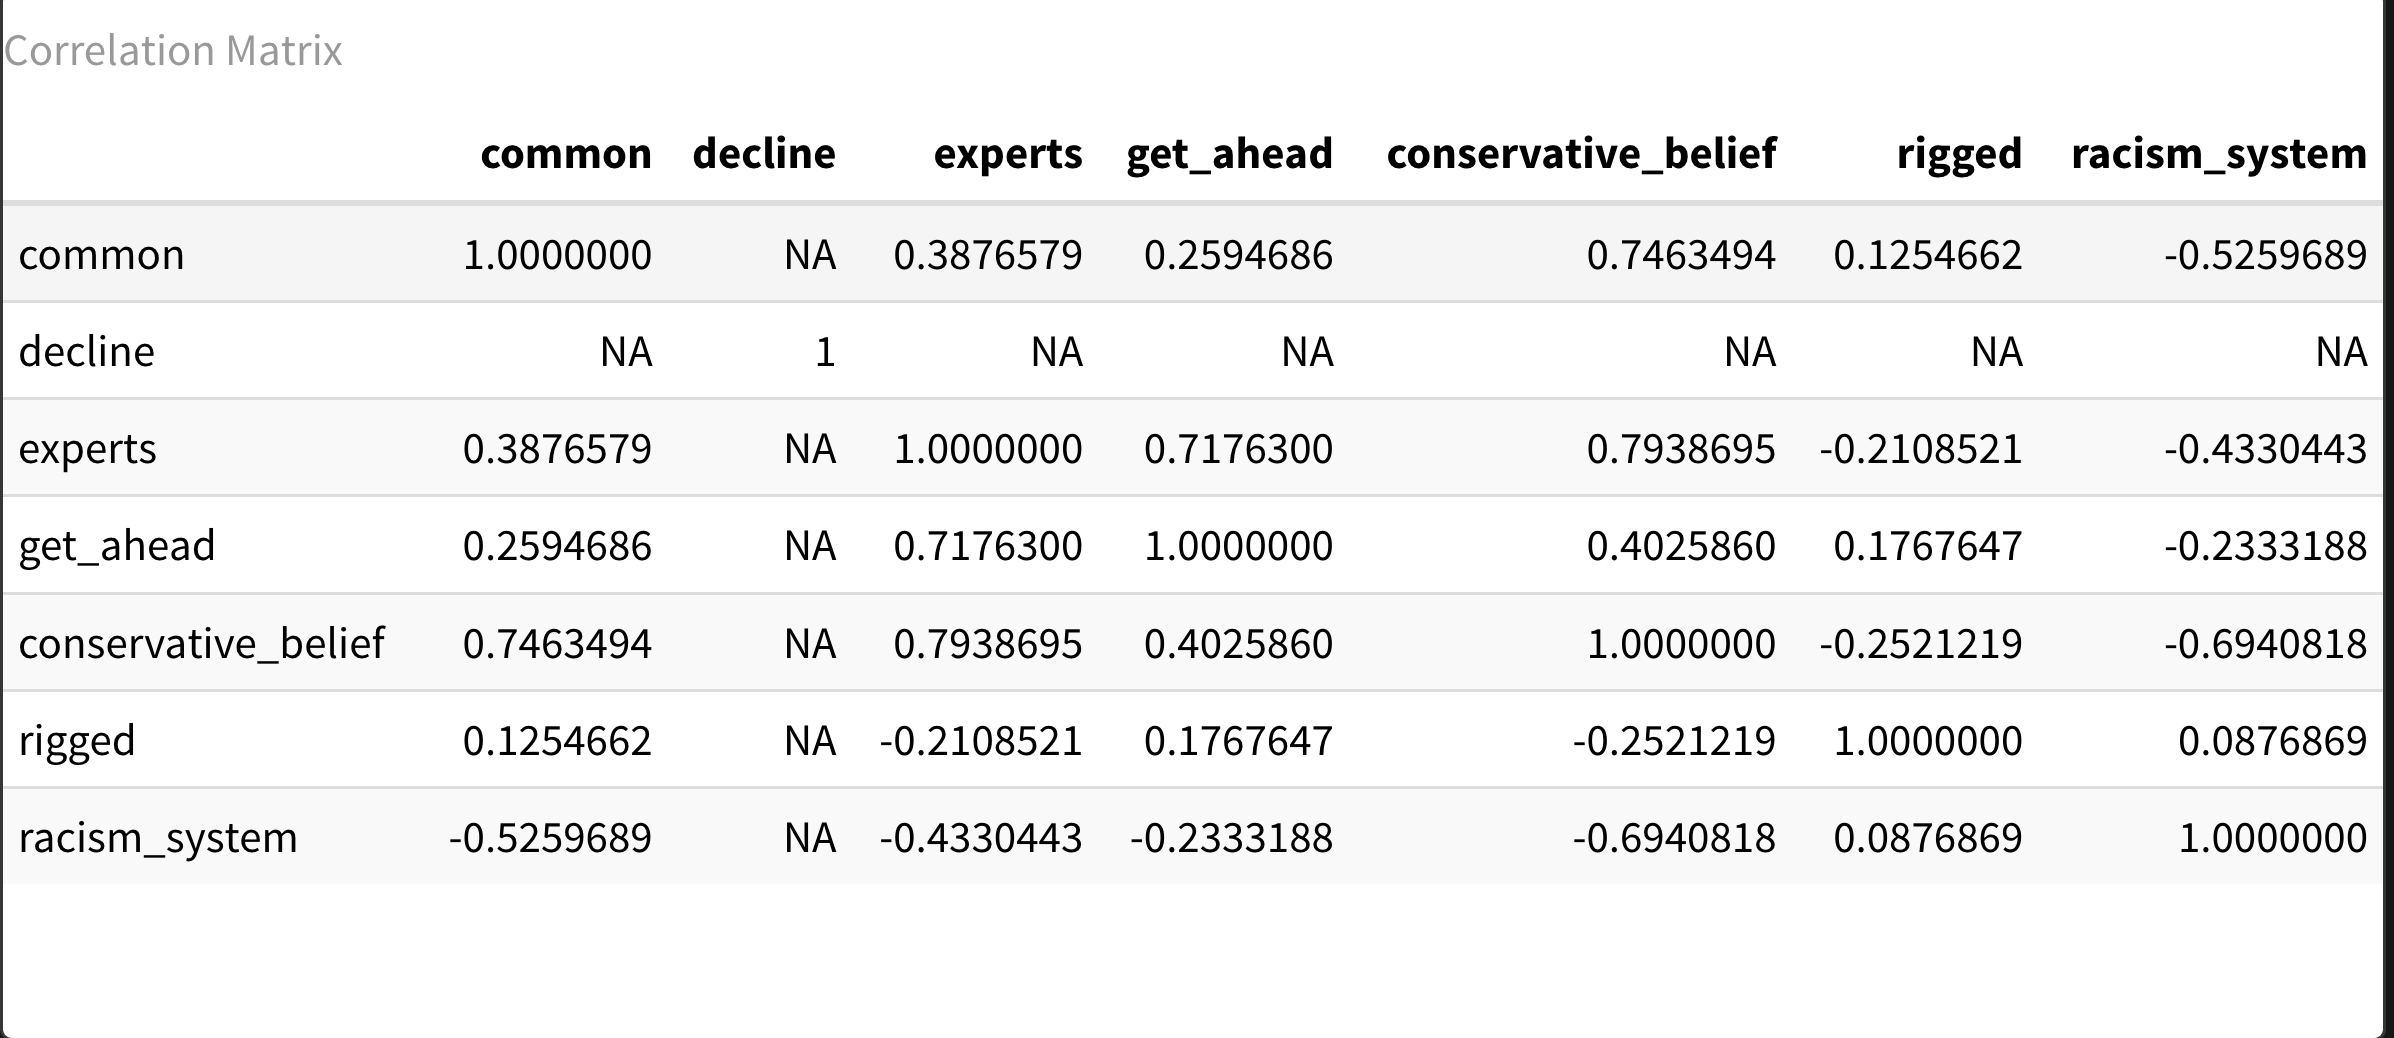
To answer a question I imagine a reader asking, even among this cute little (now) 16 observations of 9 data points, is there a correlation problem- such that if we ran regressions, we’d have issues with multicollinearity— are these various opinions super related to each other such that they would be picking up on the same impulses such that we could not disentangle them properly from each other? Here’s a correlation matrix, and it also looks ok (Decline didn’t work because I didn’t deal well with the missing county types, but I could go back and clean this later). Or at least we know which ones are related enough (I’m thinking over 7 for highly correlated) and maybe we won’t run them together in the same model, or treat them as interaction effects or something else.
OK, not enough data for our 3,143 counties. What I did, then, was take the mean and standard deviation of each of the variables (e.g. getting ahead in the US is hard) across all community types and do 3,143 random draws. Yes, I’m assuming that the variation within these will give us a value that makes sense for each county type for each of the opinion questions (that’s why there is a distribution, after all) - and that the draw for each county, regardless of type, will be within this range. Is it perfect? No, but it gives us something to work with.
After fighting with FIPS codes and data joining and all that jazz, now, I’ve got a simulated dataset of opinion data for various types of American communities. What about news data?
Well, here I went to a few sources to get some good stuff happening. I went to the Bureau of Labor Statistics to pull recent job numbers per county for news (the NAICS 2023 code is updated for digital-first newspaper publishing, which is nice). Then I also got census data for 2023 for each county’s overall population from well, the census. Then, I asked Northwestern’s Local News Initiative for their News Deserts dataset for 2023. I have had some concerns about this data, but taken together with perhaps journalism jobs per county and the media is in it for the money variables, it gives us some nice context. Then, I joined the News Deserts dataset, picking out circulation (aggregating at the county level), total media outlets per county, RUCC code, and grabbed the 2022 county population because it was there. Now, I’ve got a very fun, fairly exciting (to me) set of data. We leave out two counties in Alaska, sorry Alaska!
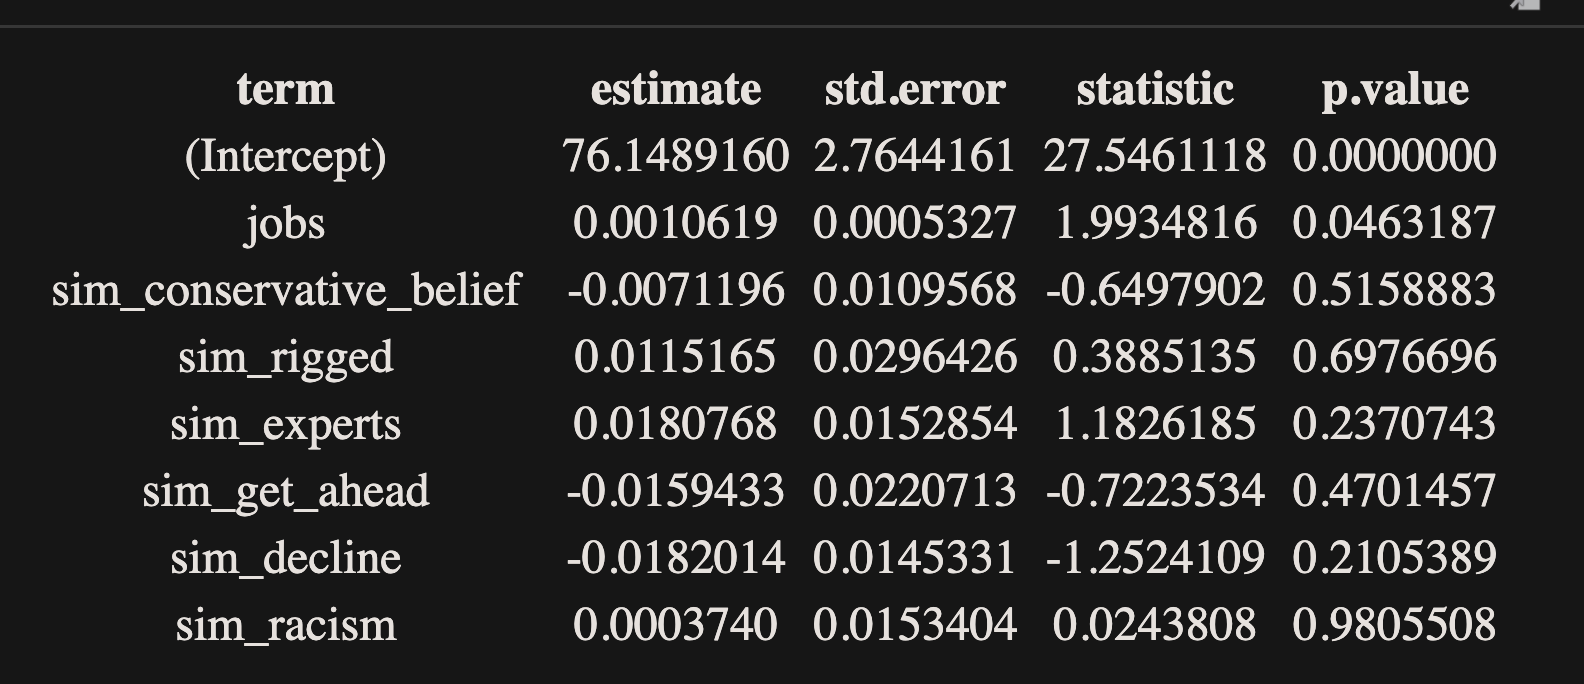
If you want a teaser, the first thing I looked at was to regress the simulated “media is in it for the money” on a bunch of different simulated and real county-level variables: conservative media beliefs, journalism jobs, whether America is rigged for the rich, whether we should believe in experts, whether it’s hard to get ahead in America, whether America is in decline, and whether the system is racist. I did one giant OLS model with all of this, and then a restricted OLS model with the media variable regressed on the America is rigged for the rich (I mean, this “rigged for the rich”) would likely correlate, at least intuitively. Well, a) the big model is better (via a likelihood test), but also, b) nada, really nada!
What about all those population differences across county type? What if we want to look at the country as a whole? Well, I mean, that’s why we control for population! (And we can start to see if population explains almost everything— well, it’s a big factor, and also, we should log it, and there’s lots more to talk about here). What about the rest of all this? Nik, can you make some plots, pls? We like plots! (well, that’s what the readers might want, but I hate ggplot).
Anyway, lots more to come, but I would be curious about your sense of whether my simulated data approach is cracked out.
Why I like this data:
The data used to cluster these communities is both commercial and provided by the US government and census data, and well, I like feeling like I KNOW these places because I’ve been through almost all of them in some capacity during my many, many meanders across the US (depending how you count, 12 + trips cross country, plus North/South routes; I’ve covered Texas from Dallas to Big Bend, the American Southwest and South, etc. and yes, I’ve even been to a gay bar in Anchorage, Alaska (ask me anything about gay bars in rural, conservative, or Southern places, and I’ve probably been to one!). I collect presidential libraries (in my head) and state capitols. I’ve been around the US, just missing North Dakota and Hawaii!