

Maybe I am Maxing Out?
Maybe I am Maxing Out?
Or, how I can't read type to typeset, and vice versa. And how I'm sad about that, because it's limiting my ability to go from math to code. Also a little bit about Missy Elliot.

I’ve hit my limit in my inability to move from one mode of thinking to another - and it literally has to do with font and print. There is no difference between the two screenshots below, formally. But I legit cannot read the one that’s in computer type. It hurts my brain.
And so when it comes to taking an equation that I mostly understand and then turning it into a function that R can solve, I legitimately want to cry. I just don’t know how to get my brain to think properly in terms of turning math into computational functions.
These two things are the same. They are incomprehensibly different to me.

If you wonder why I’m substacking, it’s because I’m stuck and want to cry, have committed myself and this time to figuring out a problem, and I just can’t go on, so it’s literally a public math tantrum to whine about how I can’t (and then I seek your encouragement to keep on trying). Because I just cannot figure out how to turn the typeset into the type without losing the thread from input in brain to output in type.
What is sad is that I do actually mostly understand the math happening (and I’m kind of proud of that!), and I think I mostly understand the logic, but I just literally cannot do it computationally - in that I cannot type the math into R to mirror what it looks like on the page. So if I’ve banged my head out today, it makes sense to at least show off that I get the logic, no?
So in a very weird and strange way, I can accept (somewhat) the basic logic of the Maximum Likelihood Estimation - essentially, you are trying to figure out the best (maximums) for the covariates of your model, given the data. This is helpful for a number of reasons: maybe you don’t have enough data, maybe you want to predict something, maybe you believe the world works in a certain way and it’s a matter of fine-tuning those estimates of how you see the world working by adjusting the model with different versions of estimators. Maybe you want to simulate new conditions for the world and wonder if the model holds given different data - is it that information and turnout always go hand in hand, and in what relationship? The possibilities for imagining what the world could be if the reality were otherwise is really the magic of economics and the promise of MLE.
There are some mental gymnastics, in which we assume the probability of your data given the model is somehow proportional to the likelihood of your parameters, conditional on the model, having generated the data. While I haven’t done this since last quarter, I do understand what’s happening in the matrix algebra proof of how to get the E’(Y) in matrix land into the E’(B) (Expected value of Y to Expected value of B, which is put the equation down, flip it, and reverse it, but a little more complicated).
P(Y given B) is proportional to L of (B, given Y) -
Whenever I think about linear or matrix algebra and transpositions and such, I really do think about Missy Elliot’s Work It, especially lyrics, “Is it worth it? Let me work it…I put my thang down, flip it and reverse it” … and I cannot be the only one? because IS IT WORTH IT, and something about a *thang being shown when showing off one’s mathy math prowess, but you do have to flip and reverse it. … moving on

…But note…that the probabilities and the likelihoods are not - the same - but proportional (like 1/2 and 1/4 are …) anyway… This is next level belief of the Central Limit Theorem (really) because you’re assuming a lot about the underlying variance of the estimated parameters having a normal distribution. Yips.
And we log this fun stuff because working with lots of products of probabilities keeps getting messier and messier. While you can’t take the log of a negative number, you can take a negative log, which by math intuition (read: smart people see it) I guess makes sense, but I dunno, SHOULD IT make sense? I hate that word intuition so much - stats and math people use it all the time, as if you don’t see it, you just don’t see it, it’s over, irrecoverable.
But I must admit that I just need to curl up into a ball because I feel so very, very incompetent. Maybe I’ve reached my peak max, which is so light years beyond what it was in June. I can run my own stats for a basic dataset and do basic OLS. I can see how I could built factor modeling and clustering into that knowledge. I am terrible at visualizing things in R, something is always wrong, but I think the internet could help me fight through some of this.
Yet I just hit a wall with creating the kinds of functions you need to just do the basic damn equations to get the whole ship running on R, even if I understand exactly what’s happening in the text. (or mostly).
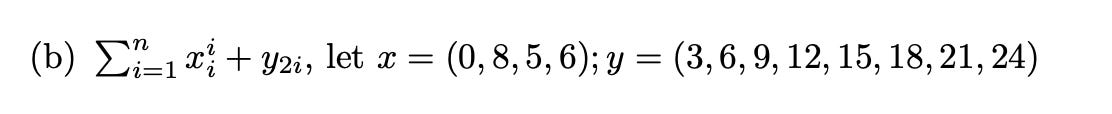
see this— below, it’s just your log likelihood of your normal distribution (great source btw). I was initially thrown off by the .5, which I didn’t connect with the 1/2 in my notes and then later the .5 in the class example. Because it’s that hard for me, these such basic moves.
The fun part is basically you put whatever you want! into U (the Betas, the Xo, Xi, etc. - the “regression equation”) - that just pops over there! Sometimes you will see the 1/2 outside the sum without the sigma. Sigma saying it to symbol below: also hard. I really do wish I had gone to university with more Greek life. (really not joking, if not for this reason alone).
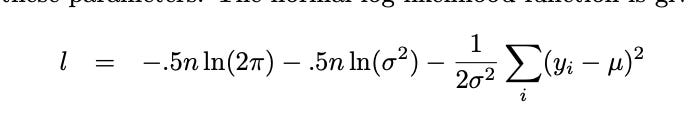
But when you have to turn this into into something that you can optimize in R, you have to first write the function above (and yes, some of these are pre-written, but you are eventually going to write your own models, and so, like, you should be able to maybe do this on your own, I guess)? - but I can’t go there. This is what the code looks like. And the disconnect from the equation to the function is crushing my soul because I do not see it, I just don’t see it. Taken from Steenbergen, 2006 …
WHERE IS N NROW? IS this is a row in some magical vector? Where is the matrix? Why is theta an argument anyway? I AM SO LOST.
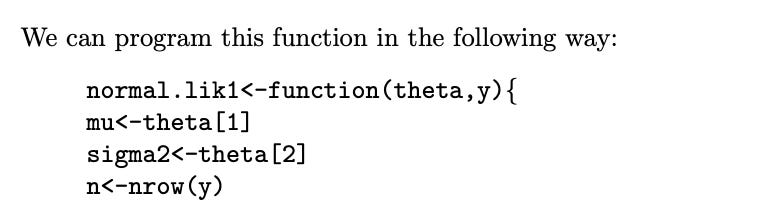
Then there’s the next part—
and what, what, does R understand what pi is written as pi? Why? What are the brackets saying? I do not see what (1/(2*sigma2) corresponds to - no, wait, I think I see it for a second, it’s this below:
If it must be known, I literally needed a substack of this many words to see that, because in whatever weird-ass way my brain works, I needed both the rest and the activity to process the little tiny bit you see above. I don’t know. I’ve figured out tricks for most of my hiccups that held me back as a student the first time: I’m far less scared of notation (my current professor - Molly Roberts - suggests to treat equations like paragraphs, read them, and I kinda do?) -
My math background is 10fold better than it was when I entered grad school, or maybe really ever (matrix algebra: work it, baby work it, take your thang down, flip it and reverse it ) - THERE IS AN ANSWER TO THE PROBLEM sometimes, and you don’t have to keep editing something into eternity and it’s satisfying… and there are lots of people to thank for that (actually, mostly Bennet Goeckner, my neighbor and USD colleague, and, to a lesser extent, math boot camp, the videos from 3brown 1 blue, and Khan Academy)… but I digress.
I’ve got adderall and an ADHD dx, which I didn’t have officially till after I took my first PhD-level stats class (diagnosed in my PhD program, first semester, yes I went to a learning center and did actual tests).
I have an iPad so I can have slides open so I can listen to the professor and take notes on the slides without worrying about copying down the slides.
I have some external proof that I am competent at other hard things and maybe I can be good at this too.
But maybe I’ve hit the max here at MLE. Because my brain cannot, unlike Missy and matrix algebra, take a thang, flip it, and reverse it from math to code and back.